
Key Stats
- Netflix reported a revenue of almost $31.6 billion in 2022.
- Netflix has approximately 238 million global paid memberships as of Q2 2023.
- Around 75 million US and Canadian adults have a Netflix subscription.
- Netflix users in the US lost almost 1.3 million North American users in six months.
- Netflix users watched an average of 3.2 hours of video per day .
- Netflix earned over $200 million in 2021 from its DVD rental service.
- Netflix is willing to spend $20 million per hour on original content.
Other Stats
- 41% of Netflix users watch without paying due to password and account sharing.
- Netflix’s market cap was over $105 billion as of October 2022.
- Netflix had at least 17,300 titles across all its international libraries as of October 2022.
- Netflix’s recommendation engine is estimated to be worth $1 billion per year.
- “Criminal Minds” was the top-watched licensed show on Netflix in 2021.
- Netflix’s “The Crown” cost an estimated $13 million per episode.
- About four-fifths of people aged 18 to 34 in the US either have Netflix or access it through shared passwords.
- Netflix’s original series from 2013, such as “House of Cards,” “Hemlock Grove,” and “Orange Is the New Black,” received 31 primetime Emmy nominations.
- Netflix’s “Squid Game” has been streamed for 1.65 billion hours collectively.
- Netflix’s shares dropped 21.8% on January 21, 2022, due to streaming competition.
- Slovakia had the largest Netflix library in 2022 with 7,990 titles.
- Netflix employed around 11,300 people.
Netflix revenue stats
Netflix Annual Revenue
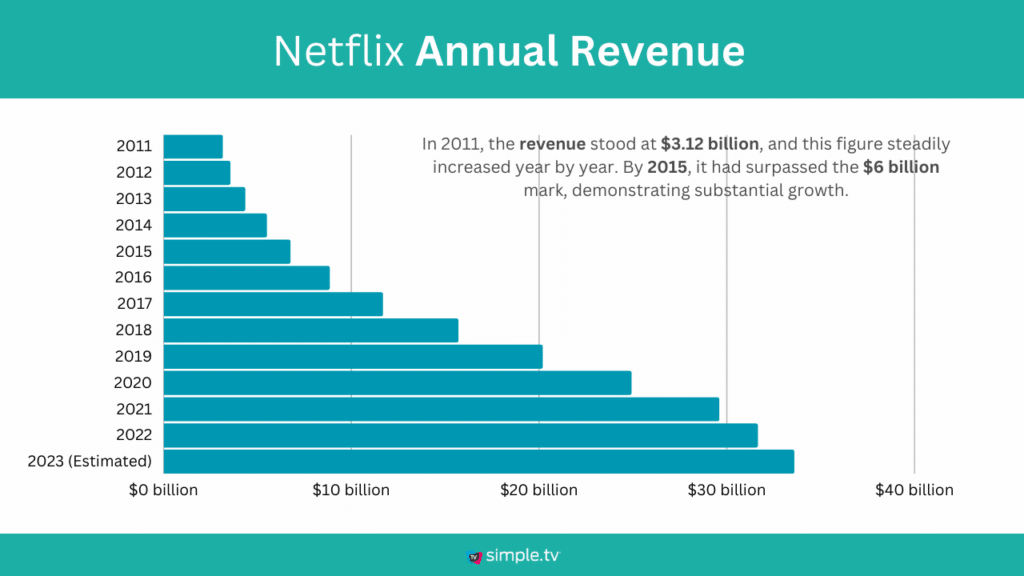
In 2011, the revenue stood at $3.12 billion, and this figure steadily increased year by year. By 2015, it had surpassed the $6 billion mark, demonstrating substantial growth.
However, the most substantial jumps occurred in the subsequent years, with revenue reaching $8.82 billion in 2016 and an impressive $11.65 billion in 2017.
In 2020, Netflix achieved a significant milestone by exceeding the $24 billion mark. The growth remained steady in 2021, with a revenue of $29.56 billion.
Looking ahead, the revenue increase to $31.62 billion in 2022, and the estimate for 2023 stands at $33.56 billion, indicating a promising future.
Netflix Annual Revenue 2011 to 2023:
| Year | Revenue ($bn) |
|---|---|
| 2011 | $3.12 billion |
| 2012 | $3.53 billion |
| 2013 | $4.32 billion |
| 2014 | $5.47 billion |
| 2015 | $6.73 billion |
| 2016 | $8.82 billion |
| 2017 | $11.65 billion |
| 2018 | $15.67 billion |
| 2019 | $20.16 billion |
| 2020 | $24.89 billion |
| 2021 | $29.56 billion |
| 2022 | $31.62 billion |
| 2023 (Estimated) | $33.56 billion |
Source: Company data
Netflix revenue by region
In 2018, the US & Canada contributed $8.20 billion, while EMEA (Europe, Middle East, and Africa) followed with $3.95 billion. Latin America and the Asia-Pacific region accounted for $2.23 billion and $0.93 billion, respectively.
The trend continued in 2020, with the US & Canada generating $11.40 billion, EMEA contributing $7.76 billion, and Latin America and the Asia-Pacific region adding $3.12 billion and $2.36 billion, respectively.
In 2021, Netflix’s revenue surged to $13 billion in the US & Canada and $9.70 billion in EMEA, with steady growth in Latin America and the Asia-Pacific region.
Projections for 2023 suggest continued growth in all regions, with an estimated $15.60 billion in revenue for the US & Canada.
EMEA is expected to reach $10.20 billion in 2023, with Latin America and the Asia-Pacific region also showing promising growth.
Netflix Annual Revenue by Region 2018 to 2023 ($bn)
| Year | US & Canada | EMEA | Latin America | Asia-Pacific |
|---|---|---|---|---|
| 2018 | 8.20 | 3.95 | 2.23 | 0.93 |
| 2019 | 10 | 5.50 | 2.79 | 1.45 |
| 2020 | 11.40 | 7.76 | 3.12 | 2.36 |
| 2021 | 13 | 9.70 | 3.58 | 3.25 |
| 2022 | 14.90 | 9.75 | 4.05 | 3.56 |
| 2023(Estimated) | 15.60 | 10.20 | 4.54 | 3.97 |
Source: Company data
Netflix Users
Netflix Users By Gender

Netflix users are fairly evenly split by gender, with 51% male and 49% female.
| Gender | Percentage |
|---|---|
| Male | 51% |
| Female | 49% |
Netflix Users By Generation

According to the latest data, Netflix has become a household name across various age groups. Millennials make up the largest share of Netflix users, comprising 33% of the platform’s audience.
Generation X isn’t far behind, accounting for 26% of the user base, while Baby Boomers, often considered the latecomers to the streaming party, still represent a significant 22%.
Interestingly, Generation Z, the tech-savvy cohort, is making its mark, constituting 18% of Netflix users.
Netflix Users By Generation
| Generation | Percentage of users |
|---|---|
| Millennials | 33% |
| Generation X | 26% |
| Baby Boomers | 22% |
| Generation Z | 18% |
Netflix Users By Age
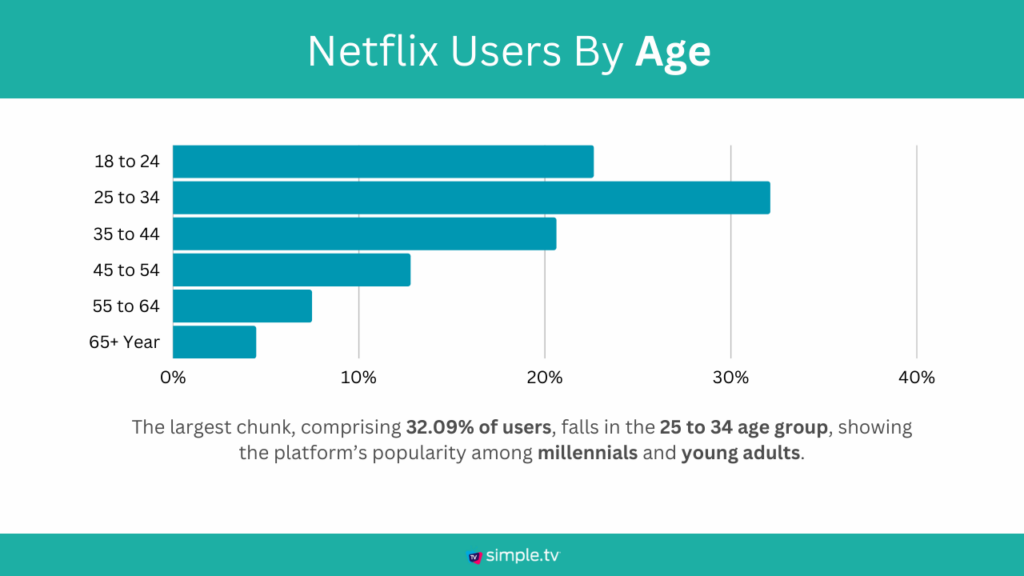
The age distribution of Netflix users paints a clear picture of their audience. The largest chunk, comprising 32.09% of users, falls in the 25 to 34 age group, showing the platform’s popularity among millennials and young adults.
The 18 to 24 age group also forms a substantial portion at 22.60%, indicating Netflix’s appeal to the younger generation.
Moving up the age ladder, the 35 to 44 age group accounts for 20.59% of users, while those aged 45 to 54 make up 12.75% of the user base.
The 55 to 64 and 65+ age groups are smaller in comparison, with 7.45% and 4.45% respectively.
| Age Group | Percentage |
|---|---|
| 18 to 24 | 22.60% |
| 25 to 34 | 32.09% |
| 35 to 44 | 20.59% |
| 45 to 54 | 12.75% |
| 55 to 64 | 7.45% |
| 65+ Year | 4.45% |
Netflix Users By Country
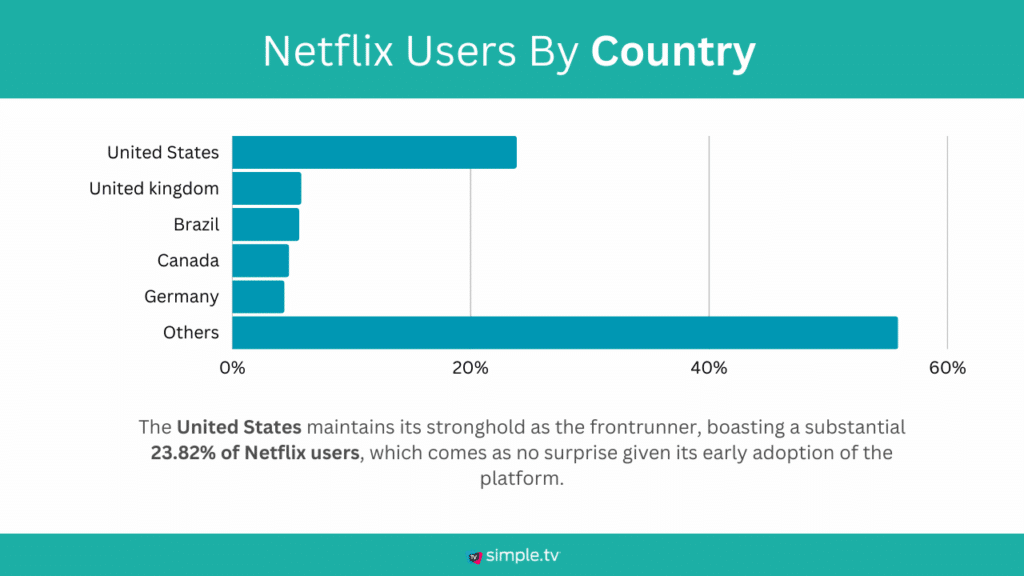
The United States maintains its stronghold as the frontrunner, boasting a substantial 23.82% of Netflix users, which comes as no surprise given its early adoption of the platform.
Meanwhile, the United Kingdom, with 5.75%, and Brazil, with 5.57%, secure their positions as the second and third largest markets, demonstrating Netflix’s international appeal.
Canada and Germany follow closely behind, contributing 4.72% and 4.33%, respectively.
| Country | Percentage |
|---|---|
| United States | 23.82% |
| United kingdom | 5.75% |
| Brazil | 5.57% |
| Canada | 4.72% |
| Germany | 4.33% |
| Others | 55.81% |
Source: Similarweb
Netflix Users By Income
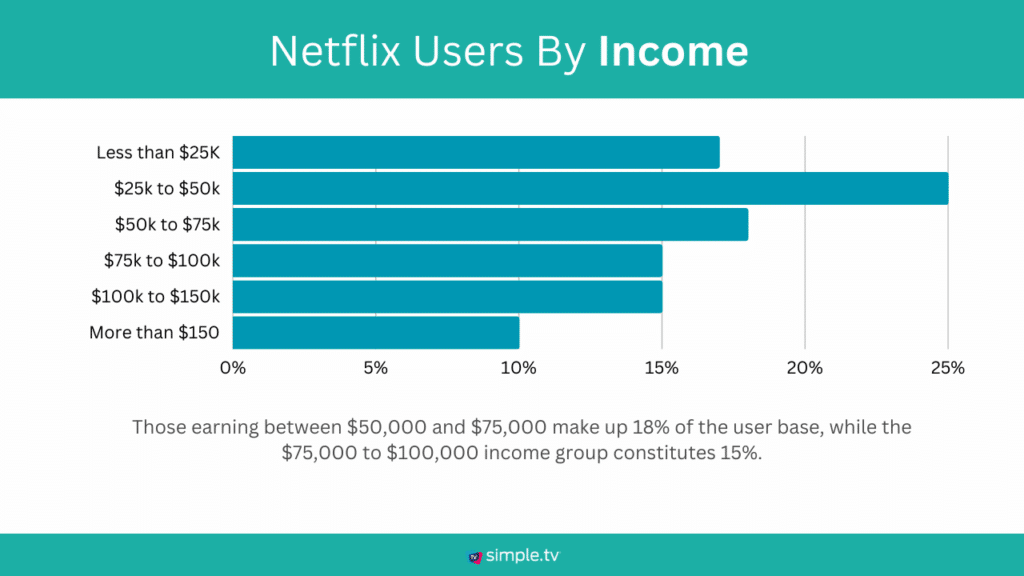
Netflix users that fall into the income bracket of less than $25,000, account for 17% of the user base.
Moving up the income ladder, the $25,000 to $50,000 bracket represents a quarter of Netflix subscribers at 25%.
Those earning between $50,000 and $75,000 make up 18% of the user base, while the $75,000 to $100,000 income group constitutes 15%.
Another 15% of subscribers fall into the $100,000 to $150,000 income category.
Finally, users with incomes surpassing $150,000 make up 10% of the Netflix subscriber base.
Users By Income
| Income | Percentage |
|---|---|
| Less than $25K | 17% |
| $25k to $50k | 25% |
| $50k to $75k | 18% |
| $75k to $100k | 15% |
| $100k to $150k | 15% |
| More than $150 | 10% |
Netflix Users By Education
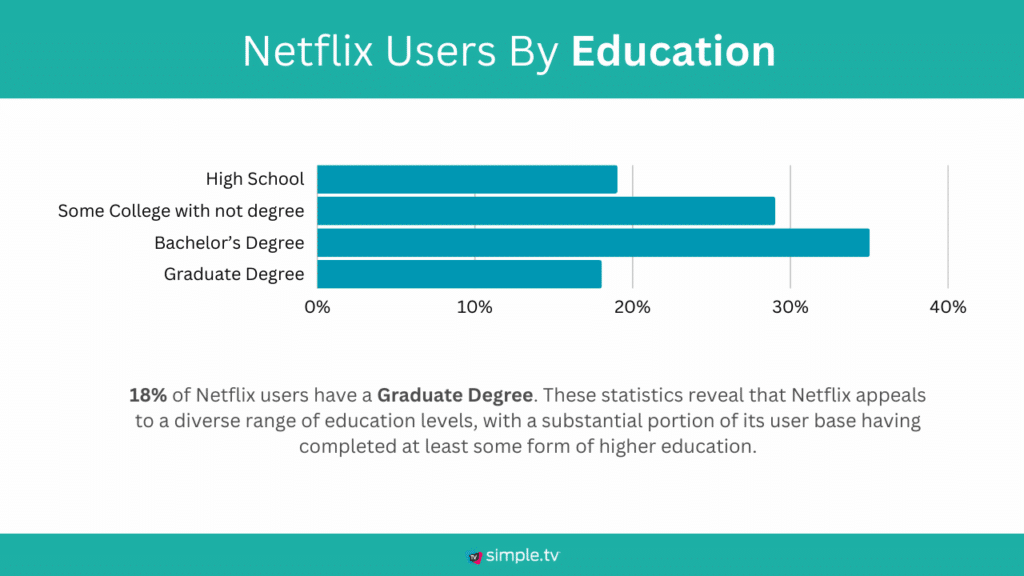
The largest group among Netflix viewers comprises those with a Bachelor’s Degree, making up 35% of the user base.
Following closely behind are those with Some College education but no degree, accounting for 29%. High School graduates also make up a significant portion, constituting 19% of users.
Lastly, 18% of Netflix users have a Graduate Degree. These statistics reveal that Netflix appeals to a diverse range of education levels, with a substantial portion of its user base having completed at least some form of higher education.
Users By Education
| Education | Percentage |
|---|---|
| High School | 19% |
| Some College with not degree | 29% |
| Bachelor’s Degree | 35% |
| Graduate Degree | 18% |
Source: Wallstreet
Netflix Market share
Market Share by Competitor

Disney has emerged as the dominant competitor of Netflix with a significant market share of $27.8 billion.
Following closely behind is Comcast, raking in $15.42 billion, while Netflix and Viacom are neck-and-neck at $15.10 billion and $15.00 billion, respectively, indicating fierce competition for the streaming audience.
| Platform | Percentage |
|---|---|
| Disney | $27.8 billion |
| Comcast | $15.42 billion |
| Netflix | $15.10 billion |
| Viacom | $15.00 billion |
| At&T | $14.20 billion |
| Amazon | $6.50 billion |
Market Share by Paid Subscribers
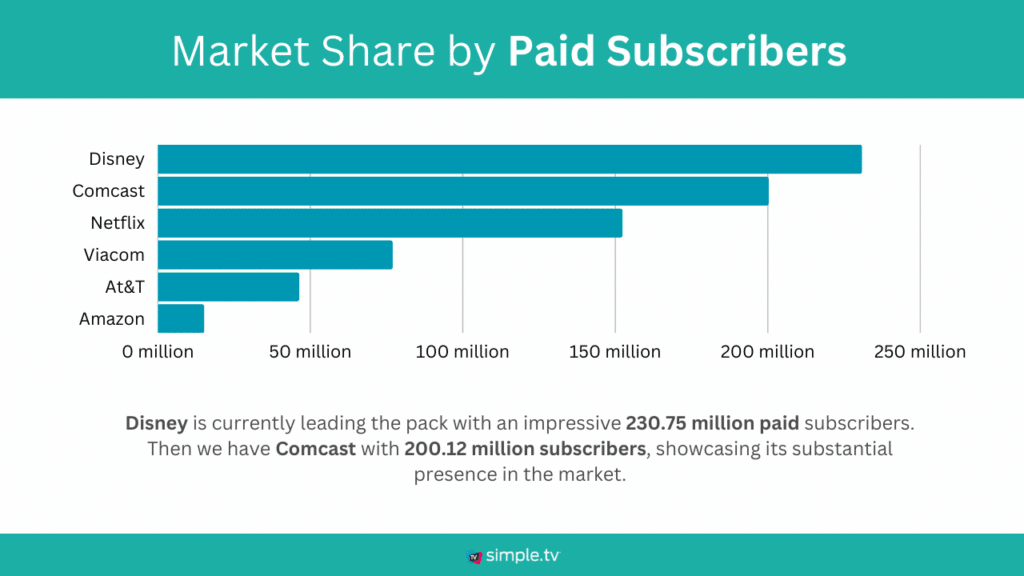
Disney is currently leading the pack with an impressive 230.75 million paid subscribers. Then we have Comcast with 200.12 million subscribers, showcasing its substantial presence in the market.
However, it’s worth noting that Netflix, while not holding the top spot, remains a significant player with 152.20 million subscribers, solidifying its position as a major contender in the streaming industry.
| Platform | Subscribers |
|---|---|
| Disney | 230.75 million |
| Comcast | 200.12 million |
| Netflix | 152.20 million |
| Viacom | 76.84 million |
| At&T | 46.2 million |
| Amazon | 15.04 million |
Netflix ARPU by region
In 2018, the US & Canada region led the way with an ARPU of $11.28, followed by EMEA at $10.20, Latin America at $7.53, and Asia-Pacific at $9.19.
Fast forward to 2023 (estimated), and we can observe some shifts. The US & Canada ARPU has experienced steady growth, reaching an estimated $16.43, solidifying its position as the highest ARPU region.
EMEA has also seen an increase, reaching $11.45, while Latin America and Asia-Pacific show modest growth with ARPU estimates of $8.85 and $9.12, respectively.
Netflix annual ARPU by region 2018 to 2023 ($bn)
| Year | US & Canada | EMEA | Latin America | Asia-Pacific |
|---|---|---|---|---|
| 2018 | 11.28 | 10.20 | 7.53 | 9.19 |
| 2019 | 13.22 | 10.51 | 8.18 | 9.07 |
| 2020 | 13.51 | 11.05 | 7.12 | 9.32 |
| 2021 | 14.78 | 11.64 | 8.14 | 9.26 |
| 2022 | 15.86 | 10.99 | 8.48 | 8.5 |
| 2023(Estimated) | 16.43 | 11.45 | 8.85 | 9.12 |
source: Company data
Netflix profit
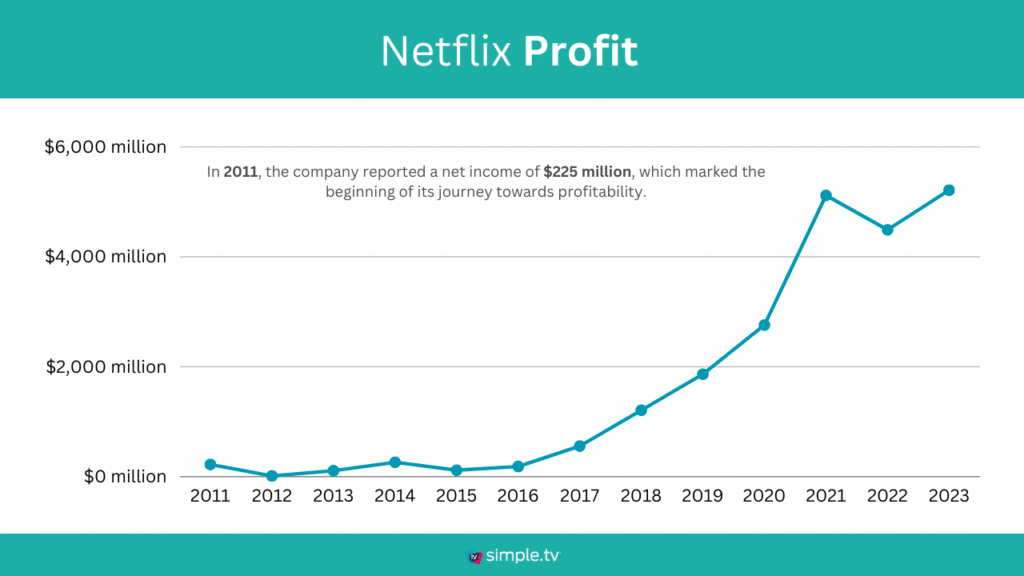
In 2011, the company reported a net income of $225 million, which marked the beginning of its journey towards profitability.
Over the next few years, Netflix encountered fluctuations in its earnings, with 2012 yielding a modest $17 million in net income, followed by $112 million in 2013.
However, the turning point came in 2014 when the company reported a substantial net income of $266 million, and it continued to climb, reaching $1867 million in 2019 and an impressive $2761 million in 2020.
In 2021, Netflix shattered expectations with a staggering net income of $5116 million, showcasing its resilience and popularity.
Looking ahead to 2022, the company reported a robust net income of $4491 million, and early estimates for 2023 predict an even higher figure at $5212 million.
Netflix annual net income/loss ($mm)
| Date | Net Income/Loss ($mm) |
|---|---|
| 2011 | $225 million |
| 2012 | $17 million |
| 2013 | $112 million |
| 2014 | $266 million |
| 2015 | $122 million |
| 2016 | $188 million |
| 2017 | $560 million |
| 2018 | $1211 million |
| 2019 | $1867 million |
| 2020 | $2761 million |
| 2021 | $5116 million |
| 2022 | $4491 million |
| 2023 (Estimated) | $5212 million |
Netflix content spend
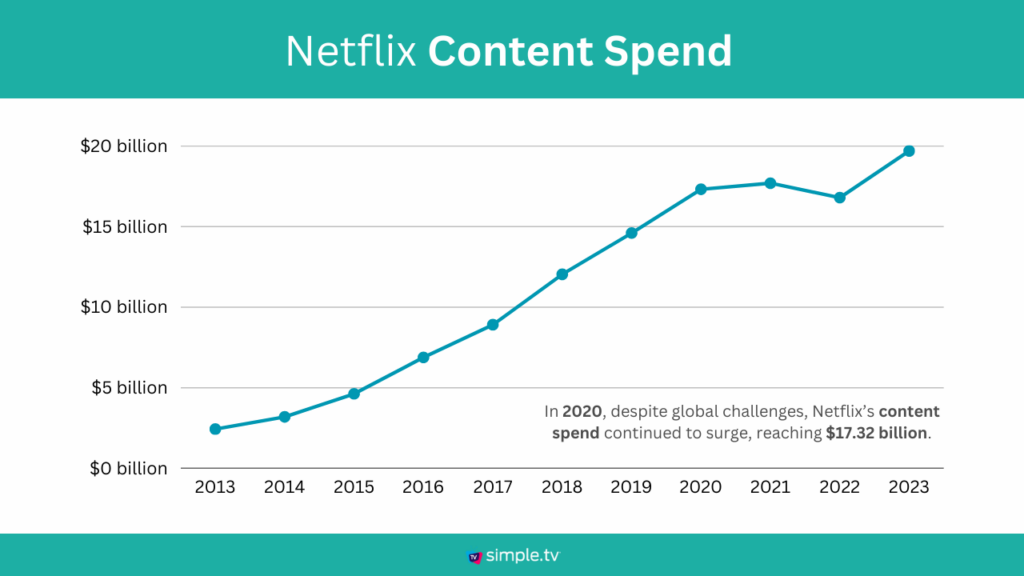
In 2013, the streaming giant spent $2.43 billion on content, and this figure steadily climbed over the years. By 2019, Netflix had poured a staggering $14.60 billion into content creation, highlighting its determination to offer a vast and diverse library to subscribers.
In 2020, despite global challenges, Netflix’s content spend continued to surge, reaching $17.32 billion.
Although there was a slight dip in 2022 with a spend of $16.8 billion, this year’s estimate shows an impressive rebound, projecting a content spend of $19.7 billion in 2023.
Netflix annual content spend ($bn)
| Year | Content spend ($bn) |
|---|---|
| 2013 | $2.43 billion |
| 2014 | $3.19 billion |
| 2015 | $4.62 billion |
| 2016 | $6.88 billion |
| 2017 | $8.91 billion |
| 2018 | $12.04 billion |
| 2019 | $14.60 billion |
| 2020 | $17.32 billion |
| 2021 | $17.7 billion |
| 2022 | $16.8 billion |
| 2023 (Estimated) | $19.7 billion |
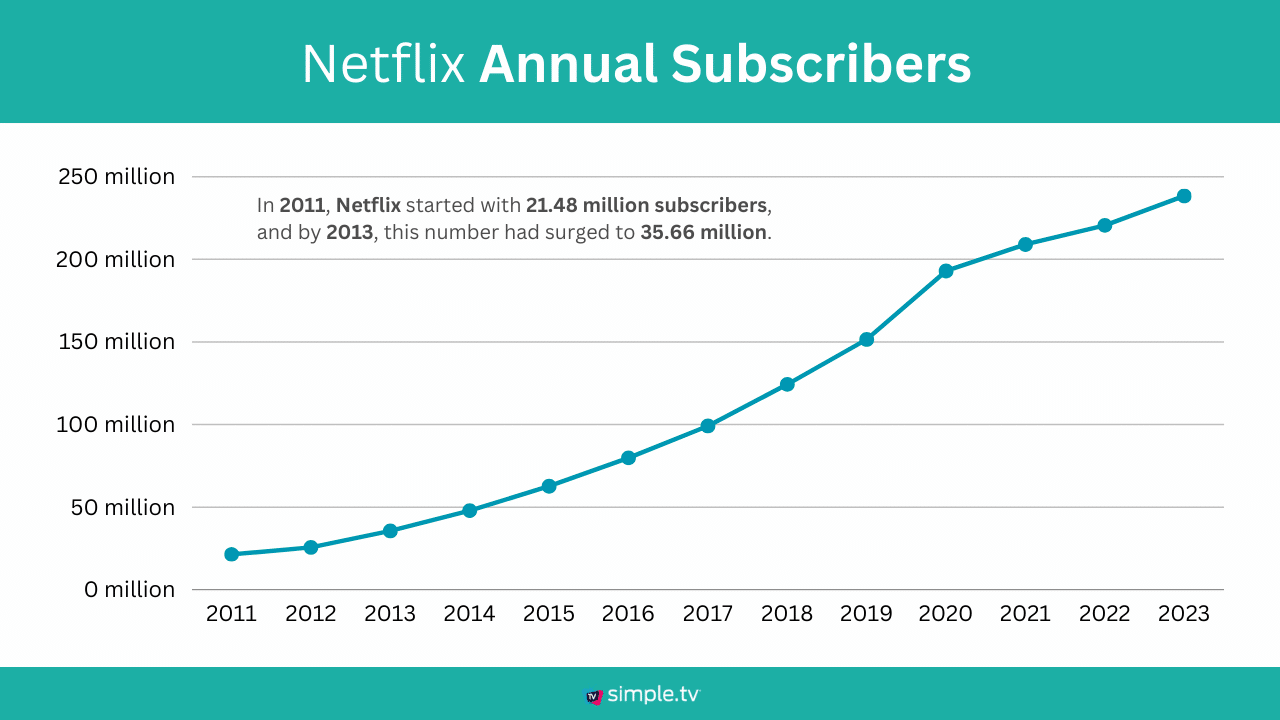
Netflix Annual subscribers
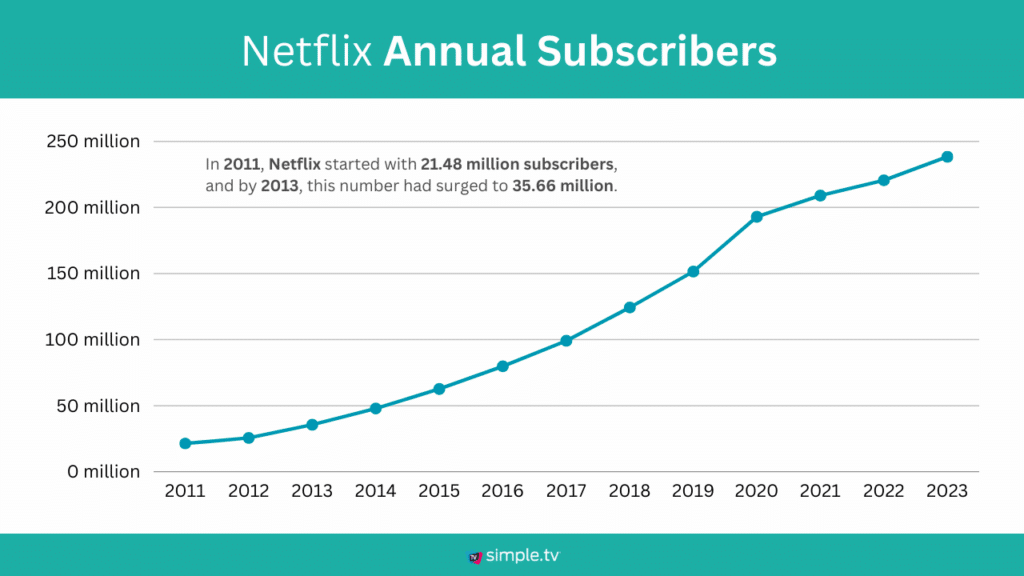
In 2011, Netflix started with 21.48 million subscribers, and by 2013, this number had surged to 35.66 million.
The subsequent years witnessed even more remarkable growth, with 2023 marking a milestone for the streaming giant, boasting a staggering 238.38 million subscribers.
As Netflix continues to push the boundaries of the streaming world, it’s clear that their appeal and influence are only getting stronger.
Netflix annual subscribers 2011 to 2023:
| Date | Subscribers (mm) |
|---|---|
| 2011 | 21.48 million |
| 2012 | 25.72 million |
| 2013 | 35.66 million |
| 2014 | 47.98 million |
| 2015 | 62.72 million |
| 2016 | 79.89 million |
| 2017 | 99.14 million |
| 2018 | 124.36 million |
| 2019 | 151.54 million |
| 2020 | 192.96 million |
| 2021 | 209 million |
| 2022 | 220.56 million |
| 2023 | 238.38 million |
Sources: Company data
Netflix subscribers by region
In 2018 Q4, the US & Canada accounted for the highest number of subscribers at 64.73 million, followed by EMEA (Europe, Middle East, and Africa) at 37.8 million, Latin America at 26 million, and Asia-Pacific at 10.62 million.
Fast forward to 2023 Q4 (estimated), we see a notable increase in these figures. Netflix’s estimated subscriber count in the US & Canada has risen to 76.12 million, while EMEA has witnessed substantial growth, reaching 79.82 million subscribers.
Latin America and Asia-Pacific have also seen impressive expansion, with 43.51 million and 45.24 million subscribers, respectively.
Netflix Annual Subscribers 2018 to 2023
| Year | US & Canada | EMEA | Latin America | Asia-Pacific |
|---|---|---|---|---|
| 2018 Q4 | 64.73 | 37.8 | 26 | 10.62 |
| 2019 Q4 | 67.61 | 51.7 | 31.43 | 16.23 |
| 2020 Q4 | 73.91 | 66.7 | 37.52 | 25.42 |
| 2021 Q4 | 75.23 | 74 | 39.9 | 32.64 |
| 2022 Q4 | 74.24 | 76.74 | 41.72 | 38.01 |
| 2023 Q4 (Estimated) | 76.12 | 79.82 | 43.51 | 45.24 |
Source: Sec Filing
Netflix library
Topping the list is Slovakia, with a whopping 8,417 titles in Netflix’s library. Bulgaria closely follows with 8,275, while Latvia and Estonia round out the top five with 8,095 and 8,051 titles, respectively.
It’s worth noting that Netflix provides a diverse range of options across the globe, with the UK, Portugal, and Ireland all boasting over 7,000 titles.
| Country | Titles in Netflix’s Library |
|---|---|
| Slovakia | 8,417 |
| Bulgaria | 8,275 |
| Latvia | 8,095 |
| Estonia | 8,051 |
| Iceland | 8,032 |
| Lithuania | 7,984 |
| Romania | 7,726 |
| UK | 7,476 |
| Portugal | 7,422 |
| Ireland | 7,378 |
| Spain | 7,367 |
| Germany | 7,345 |
| Hungary | 7,334 |
| Italy | 7,242 |
| Austria | 7,167 |
| Switzerland | 7,145 |
| Philippines | 7,122 |
| Greece | 7,024 |
| Netherlands | 6,932 |
| France | 6,841 |
Source: WorldPopulation
Netflix share of US streaming minutes
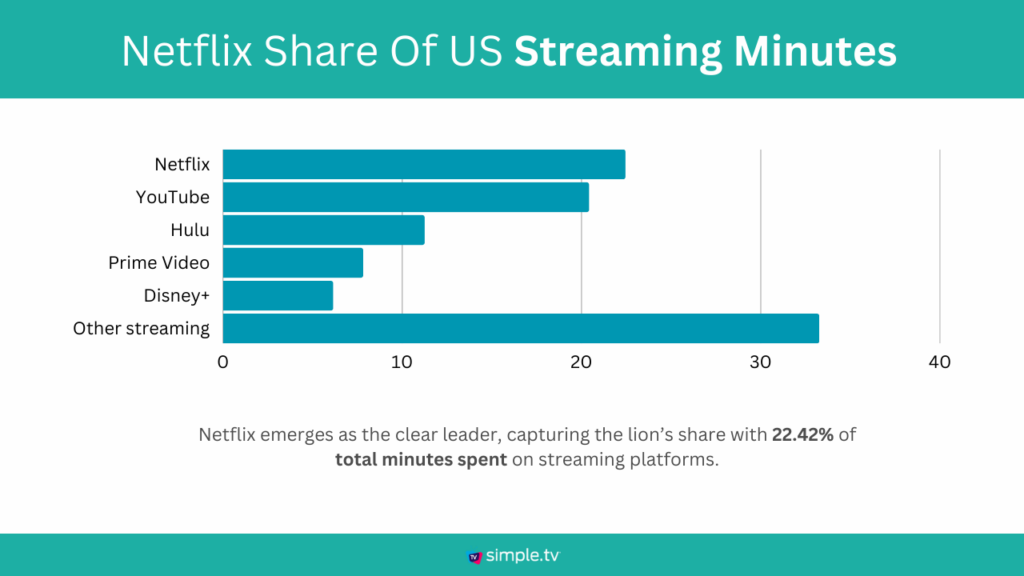
Netflix emerges as the clear leader, capturing the lion’s share with 22.42% of total minutes spent on streaming platforms.
Not far behind is YouTube, commanding 20.39% of viewer attention, while Hulu maintains a respectable 11.22%. Amazon Prime Video and Disney+ follow suit with 7.79% and 6.12%, respectively.
US Audience streaming minutes
| App | Percentage of minutes spent |
|---|---|
| Netflix | 22.42 |
| YouTube | 20.39 |
| Hulu | 11.22 |
| Prime Video | 7.79 |
| Disney+ | 6.12 |
| Other streaming | 33.23 |
Source: Nielsen